
Yahoo Answers is shutting down on May 4th, 2021 (Eastern Time) and the Yahoo Answers website is now in read-only mode. There will be no changes to other Yahoo properties or services, or your Yahoo account. You can find more information about the Yahoo Answers shutdown and how to download your data on this help page.

Jeff M
I have a website that I just started at http://www.myvancouvertoday.ca I'll try and stop by here every now and then to ask and answer various questions concerning the province I live in so I can get more of a handle on what people want to know and would like.
Earth's blackbody radiation curve and greenhouse gases / global warming?
This post has various questions related to it that I am curious about. Kano believes the planet is warmer than what it would be if solar input were only taken into account from pressure. However if we look at the blackbody curve of the Earth we see that this isn't the case. Gases retain energy at specific frequencies and we can see the amount of energy they retain.
http://www.giss.nasa.gov/research/briefs/schmidt_0...
You can clearly see the dips of both CO2 and ozone as well as the continuum outside of the atmospheric window of water vapour. How much warming, given the graph above or the data to output that graph, does CO2 alone contribute?
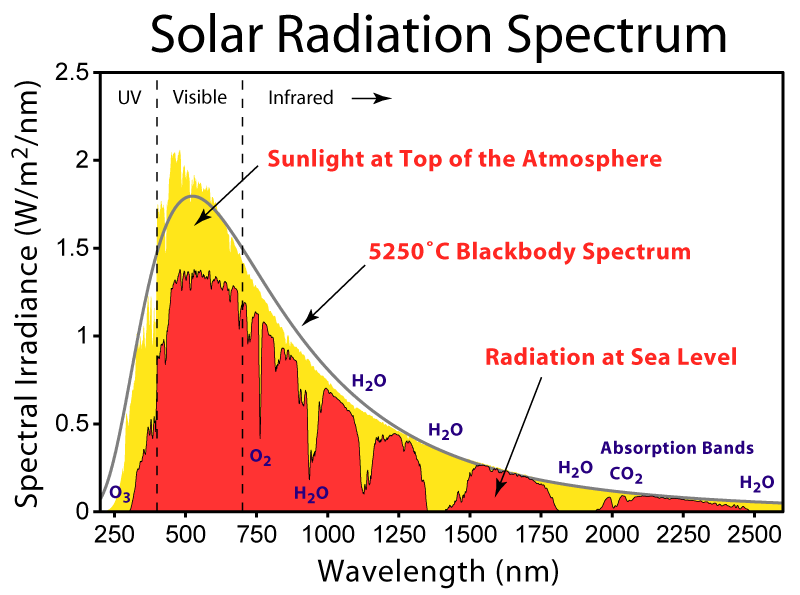
Co2 and other gases absorb at more than just within the Earth's blackbody curve. If we look at solar input we see this: http://upload.wikimedia.org/wikipedia/commons/4/4c...
Would the net effect of absorption of gases be one of cooling or warming with regards to solar input and how did you come to that conclusion mathematically?
3 AnswersGlobal Warming6 years agoWhat do you think of iron fertilization?
22 AnswersGlobal Warming6 years agoState of the climate 2013 and the future?
The American Meteorological Association recently released their State of the Climate 2013 report. 2013 was between the 2nd and 5th warmest year on record according to what data set you look at. This occurred without a prominent El Nino. Though we are currently headed into one now, and despite early reports of it being a strong one, it now appears that it won't be. It appears as if there is quite a lot of information in the 2013 report and it follows the long term warming trend. Do you see any problems in the peer reviewed report? If so could you explain them in-depth with measurements and data? And where do you see the future heading in terms of all of the data located in the report?
3 AnswersGlobal Warming7 years agoRosby waves and the jet stream?
So it looks like the polar vortex is meandering to the south again with warmer temps on the west coast of North America and cooler temps on the east coast. I have been looking more into this lately and have read that this is due to changes in Rosby Waves and their interactions with the jet stream. I have also read that as the world warms this will occur more frequently and the blocking patterns they form will occur more. Can anyone explain what the interaction between Rosby waves and the jet stream causes? Why does this occur? What impact has a warming environment had thus far and what can we expect in the future?
9 AnswersGlobal Warming7 years agoAnyone up to this task?
Often we hear that climate change is a scam, the world is not warming, CO2 will not cause warming, etc... There is a physicist that has put a $10,000 challenge to anyone that can show climate change to be false via the scientific method. Anyone in here up tp this task? If you are could you post your responses, or links to them here?
17 AnswersGlobal Warming7 years agoSurface temps have flatlined?
Recently I answered a question concerning global warming and 'enviros'. In it it was stated that 'enviros' stand in the way of advancement. The questioner basically stated something similar to those that acknowledge global warming are also the ones that stand in the way of green advancement. I brought up three separate points that I have seen argued in here by the 'skeptic' side. One of those points was that 'surface temps have flatlined since 1998" and it was agreed by the questioner. This has been argued in here numerous times. The question seems unaware of just what data measured surface temps and what data measures other temps.
A couple surface temperature data sets.
http://data.giss.nasa.gov/gistemp/graphs_v3/Fig.A2...
http://www.ncdc.noaa.gov/sotc/global/2013/13
http://www.cru.uea.ac.uk/cru/data/temperature/HadC...
Does this look like surface temps have flatlined since 1998? Lets look at what data sets are cherry picked to claim this.
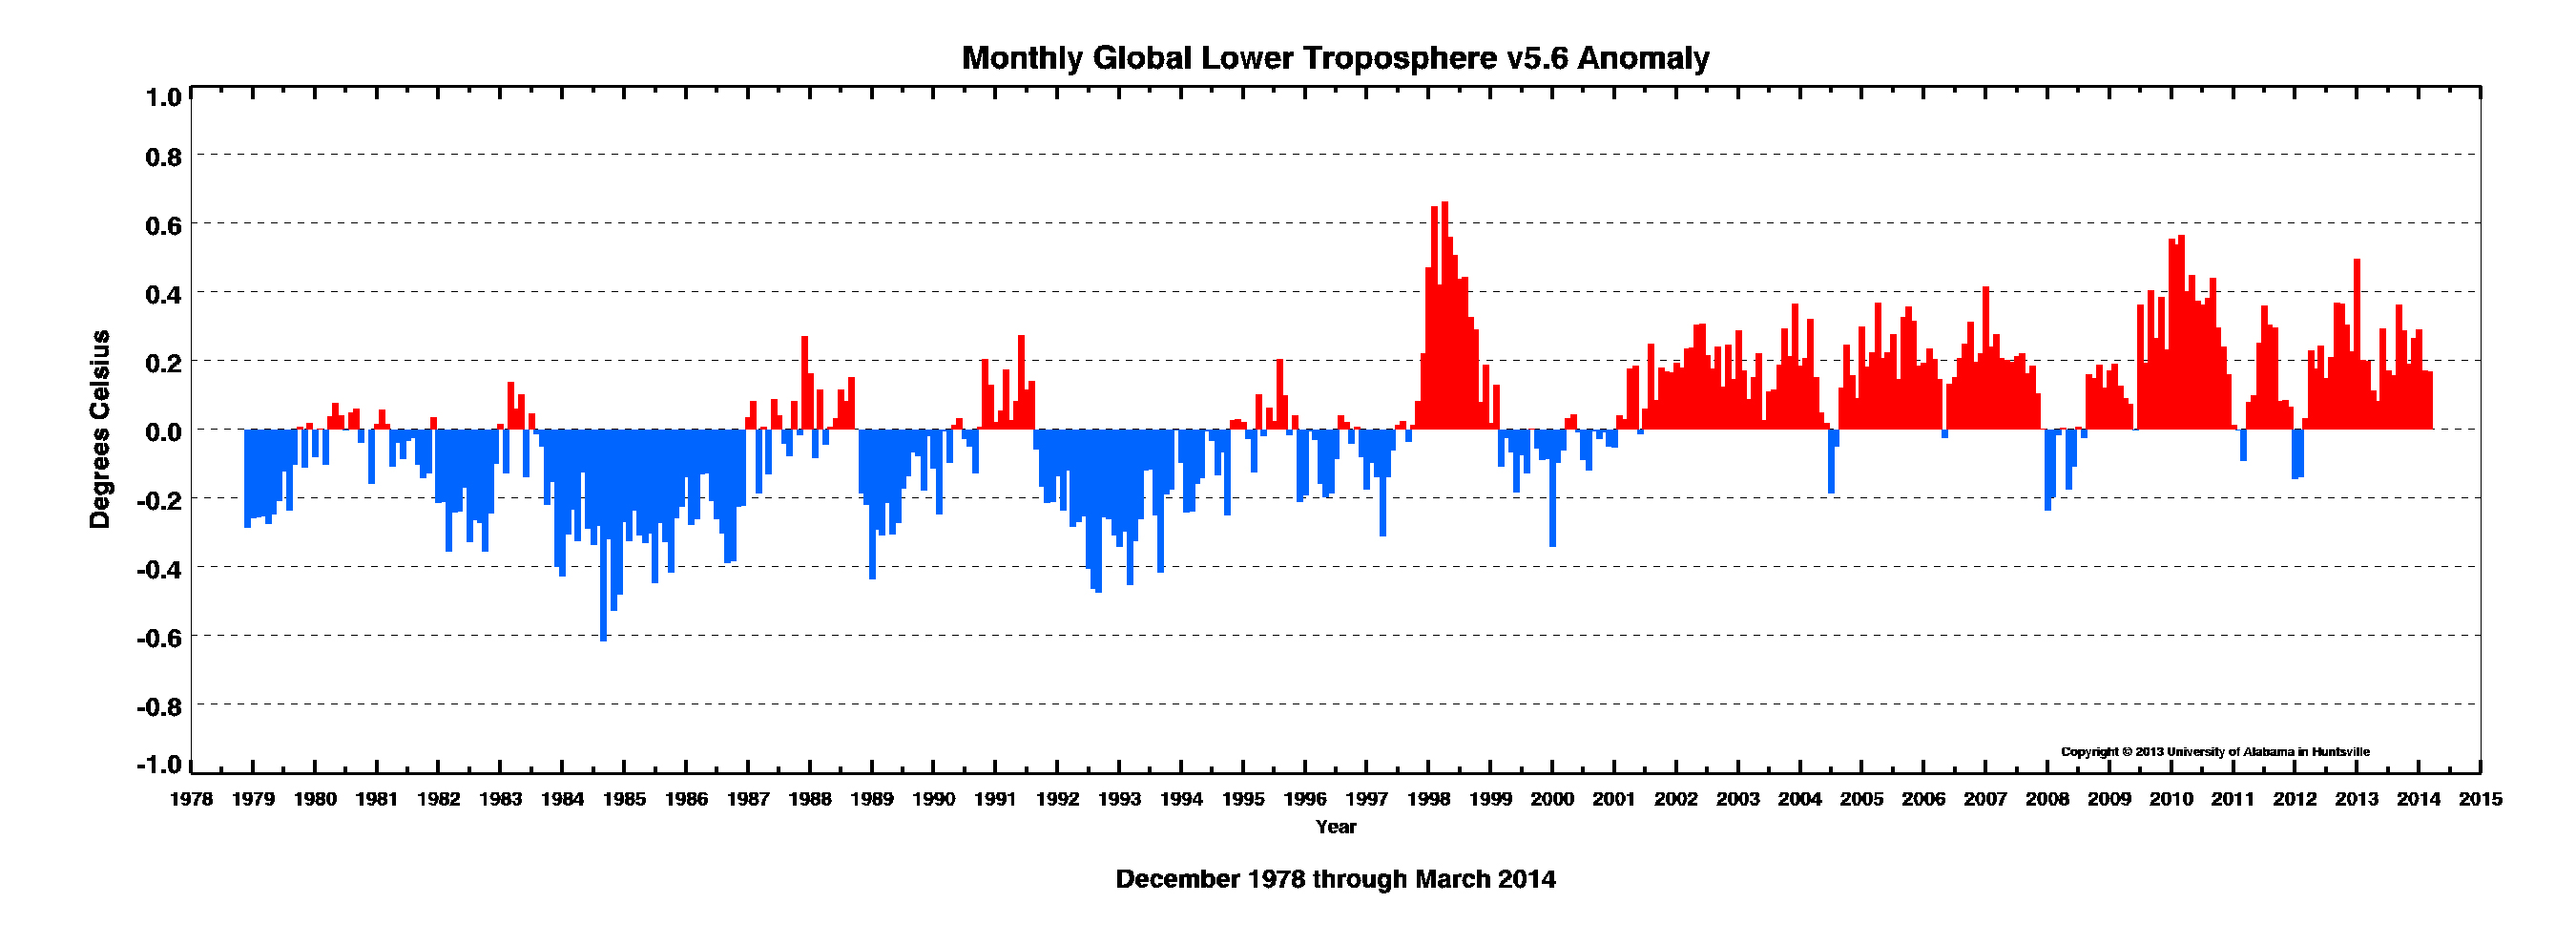
http://nsstc.uah.edu/climate/2014/march/032014_tlt...
http://images.remss.com/msu/msu_time_series.html
Whats the difference between these data sets? One is surface temps while the other deals lower tropospheric temps. Though this has been pointed out many times before it continues being brought up in here. Why do you think this is? And why are do there continue to be arguments concerning these types of things?
9 AnswersGlobal Warming7 years agoEl Nino later this year?
Models show that there is approximately a 50% probability that an El Nino will develop later this year. The ENSO cycle has been neutral for approximately 2 years now. Looking at recent temperature anomalies we see that upper ocean heat changes associated with a possible El Nino-type episode,
http://www.cpc.ncep.noaa.gov/products/analysis_mon...
If we look at wind speeds we see the following
http://www.cpc.ncep.noaa.gov/products/CDB/Tropics/...
Projections call for a, perhaps moderate, El Nino event beginning in Northern hemisphere summer.
http://www.cpc.ncep.noaa.gov/products/analysis_mon...
Projections usually occur up to 6 months in advance. However there is a new forecasting method that allows projections up to one year in advance.
http://www.pnas.org/content/110/29/11742.full
In the coming year how do you see sea surface temperature anomalies changing, how do you see surface global temperature measurements changing, and what do you make of this new projection method? Note: I have read that this new projection method calls for a 76% chance of an El Nino event later this year.
13 AnswersGlobal Warming7 years agoWhat do you think of the China's war on pollution?
In his first annual speech one of the Chinese premier's promises was to curb pollution in the country. he would start by shutting down 50,000 coal fired burners this year and clean up major ones. He also made statements that he would remove six million high emissions vehicles from the roads. I see no mention of how many new plants are currently being built though.
http://america.aljazeera.com/articles/2014/3/5/chi...
What do you make of this and how do you think China will change, both pollution-wise and emission-wise, in the coming years?
10 AnswersGlobal Warming7 years agoRegarding the tropospheric hot spot?
It has been questioned if the tropospheric hot spot exists or if it does not. The tropospheric hot spot is a consequence of increasing condensation at higher heights in the tropics. If the tropospheric hot spot exists, then, this would act as a negative feedback. If it does not exist this means that the additional water vapour in the troposphere is staying there providing an increasing greenhouse effect. There are comments on it here: http://www.climatedialogue.org/the-missing-tropica...
So, using your understanding with links to accredited educational sites such as universities, NOAA, NASA, and so on, are there any problems with my comments or the comments on the link provided above by the scientists in the debate?
4 AnswersGlobal Warming7 years agoIs the positive water vapour feedback "unproven and disputed"?
There was recently a post by Kano stating this. I contend that the positive water vapour feedback is factual. Kano has attempted to call into question the positive water vapour feedback by posting a graph showing showing 'relative humidity' staying stable in the lower troposphere, declining slightly until becoming stable in the mid-troposphere and declining in the upper troposphere. I don't think he knows what relative humidity means. Water vapour concentration has increased by 1.3% per decade since 1988 over the worlds oceans.
http://envsci.rutgers.edu/~toine379/extremeprecip/...
It is known the clouds can act both as a positive feedback (high level clouds) and a negative feedback (low level clouds). Here is one of the data sets regarding cloud abundance in various layers from 1983 to 2006.
http://isccp.giss.nasa.gov/products/browsed2.html
You can also retrieve this data from the http://mynasadata.larc.nasa.gov/ site. High-level clouds show a peak in 2001 but have remained relatively stable elsewhere. Low-level cloud coverage has not changed much either with a peak in late 1997. Mid-level cloud coverage seems to have declined slightly.
Can you describe to me what parts of the water vapour feedback mechanism remain unproven and disputed? Also. post any other data sets that are relevant to this discussion. (Note: I said data sets not blog posts)
11 AnswersGlobal Warming7 years agoWhat causes trade winds to change?
There was a recent question posed by Ottawa Mike regarding changes in trade winds in which he claimed that it was just another reason to explain the 'pause' or 'hiatus' in surface warming. I responded by making the statement that changes in trade winds are what affect both the ENSO and PDO cycles as well as other oceanic oscillations, which have been used to explain this hiatus. GraphicConception then went on to explain more in-depth about how and why changes in trade winds have effects on this for which I gave him a thumbs up. He then posed a question asking basically what was the cause of changes in trade winds? I suppose we could also include such things other major wind systems and the jet stream in this question.
http://www.seas.harvard.edu/climate/seminars/pdfs/...
In the link above it also states that, in GCMs, trade winds will weaken though I am sure that this is just a possibility. One of the effects of changing trade winds would be changes in ENSO and PDO frequency and occurrence. In which ways do you think a warming atmosphere will affect these winds and, as a consequence, various ocean oscillations? What will be the effect on surface temperatures?
7 AnswersGlobal Warming7 years agohow many in here do you think are truly interested in this topic?
Recently there was a question posed by a certain individual who struck me as someone who is more open to real data and arguments instead of what they personally believe. One of their main arguments is that the effect of CO2 is 'saturated' and that the warming trend can not be the cause of increased CO2. Basically he is stating that all the energy that is capable of being retained by CO2 is already being retained. I then showed him various papers from 1984, 2001, 2003, 2006, 2009, 2013 and so on that show that outbound energy at the frequencies CO2 absorbs at is decreasing. This goes against exactly what he has been arguing yet his response to that is the following:
"Jeff M. all that is evidence that CO2 in our atmosphere is increasing, we know that, but it is not evidence of it causing warming."
Another poster, who was later picked as best answer, claims that I only got this information from "one Warmist paper from 1983 to show CO2 drives climate."
http://answers.yahoo.com/question/index?qid=201401...
Are you tired of giving real answers only to have them not understand or completely write them off?
13 AnswersGlobal Warming7 years agoDoes this help you visualize the Polar Vortex?
Why do you think climate skeptics, such as good ole Rush Limbaugh, state that it is just made-up and doesn't exist?
10 AnswersGlobal Warming7 years agoArctic sea ice up 60%?
So am I understanding this right? There has been quite a few posts in here concerning Arctic sea ice being more this year than last year. now Goddard, according to twitter, is claiming that ice volume is at a 4 year high. He claims it is 67% higher. To get to this he does it in a rather unique way. He looks at the JAXA daily maps and counts the pixels....
https://twitter.com/rpallanuk/status/3797244020381...
Why did this not get published I wonder?
9 AnswersGlobal Warming8 years agoWould you consider this a good write-up on recent temperature trends?
http://www.yaleclimatemediaforum.org/2013/09/exami...
It states that the Earth has generally warmed but that there has been a slowdown recently. It talks about the differences between satellite observations and surface measurements. It also talks about ocean temperatures and deep ocean temperatures then goes on to state that most climate models have either problems figuring out decade-to-decade variability or climate sensitivity. What do you think of this article and, if you do not agree with it, how would you change it?
13 AnswersGlobal Warming8 years agoThe importance of cosmic rays in climate science?
Shifting cosmic ray intensity has been thought to be a contributor to global warming since the 1970s/80s. The cosmic ray flux is heightened in periods of low solar activity. This can be seen in measurements.
http://ulysses.sr.unh.edu/NeutronMonitor/Misc/neut...
http://cr0.izmiran.rssi.ru/mosc/main.htm
Jasper Kirkby has been hard at work at CERN attempting to find a link between the two.
http://www.nature.com/nature/journal/v476/n7361/ab...
There was recently news concerning a study to be released by Svensmark claiming that shifting cosmic ray intensity can account for over half of what is currently attributable to anthropogenic forcing.
http://www.dtu.dk/english/News/Nyhed?id={ABB2F1B4-...
Low level cloud cover over the last solar cycle has actually increased corresponding with increased cosmic ray intensity.
http://www.leif.org/EOS/Cloud%20Cover%20and%20Cosm...
Curious what you make of this.
11 AnswersGlobal Warming8 years agoRecent study regarding the Sun?
In a recent study, approved earlier this month, in PNAS uses diurnal temperature range to establish how much solar radiation is hitting the surface. They show that solar input reached a peak in the 1940s and 1950 and has steadily fallen since then. since the mid-1980s solar input has been relatively unchanged. Do you see any problems with this paper after reading it through? Note: this is different than data from sunspot cycles in that these measurements also take into account such things as aerosol activity.
4 AnswersGlobal Warming8 years agoNew paper on warming hiatus?
Curious what you think of this paper. As anyone who visits this site regularly and reads my posts, as well as those of others, though there is a current hiatus, meaning a period of not as drastic warming, for the last decade or so the energy imbalance of various greenhouse gas still exists as measured by satellites.
http://proceedings.spiedigitallibrary.org/proceedi...
The above paper states that there has been a decrease of -0.06 K/yr over the course of ten years related to CO2 increases. There has also been a decrease of -0.04 K/yr in the O3 brightness temperature and a decrease of -0.03 K/yr in the CH4 brightness temperature over that same 10 year time period. This amounts to a total decrease of 0.13K/yr or 1.3K in total during that time period due to changes in those three greenhouse gases alone.
A new paper shows that the warming hiatus may be caused by the IPO, which has a temperature profile very similar to the PDO.
http://www.mfe.govt.nz/publications/climate/climat...
Is there any errors in this question? If so would you point them out to me? If not, what do you make of this new information and where do you see the climate change debate in the social and political arena headed from here?
4 AnswersGlobal Warming8 years agoHow does a planet cool?
It's been stated in here numerous times that over the past decade or so the Earth has cooled while the CO2 concentration has increased. I have pointed out to the person stating this that what they are looking at is surface measurements and not measurements for the entire system. The energy balance at the top of the atmosphere continues to show that more energy is being held within the system that are exiting the system. Giving the entire system, meaning from the core to the top of the atmosphere, how many ways are there for the planet to cool as more energy is retained? And is there any sources of data by which this user can actually prove the entire system is cooling?
5 AnswersGlobal Warming8 years ago