
Yahoo Answers is shutting down on May 4th, 2021 (Eastern Time) and the Yahoo Answers website is now in read-only mode. There will be no changes to other Yahoo properties or services, or your Yahoo account. You can find more information about the Yahoo Answers shutdown and how to download your data on this help page.

Surface temps have flatlined?
Recently I answered a question concerning global warming and 'enviros'. In it it was stated that 'enviros' stand in the way of advancement. The questioner basically stated something similar to those that acknowledge global warming are also the ones that stand in the way of green advancement. I brought up three separate points that I have seen argued in here by the 'skeptic' side. One of those points was that 'surface temps have flatlined since 1998" and it was agreed by the questioner. This has been argued in here numerous times. The question seems unaware of just what data measured surface temps and what data measures other temps.
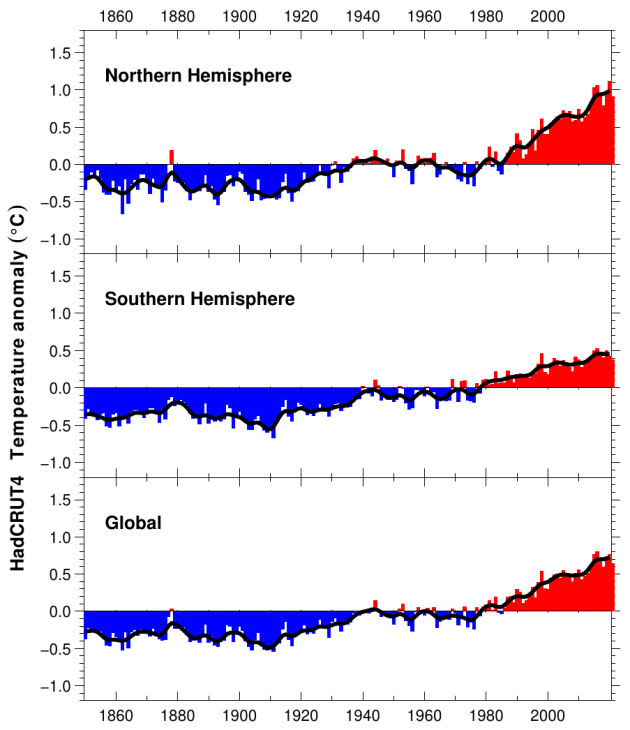
A couple surface temperature data sets.
http://data.giss.nasa.gov/gistemp/graphs_v3/Fig.A2...
http://www.ncdc.noaa.gov/sotc/global/2013/13
http://www.cru.uea.ac.uk/cru/data/temperature/HadC...
Does this look like surface temps have flatlined since 1998? Lets look at what data sets are cherry picked to claim this.
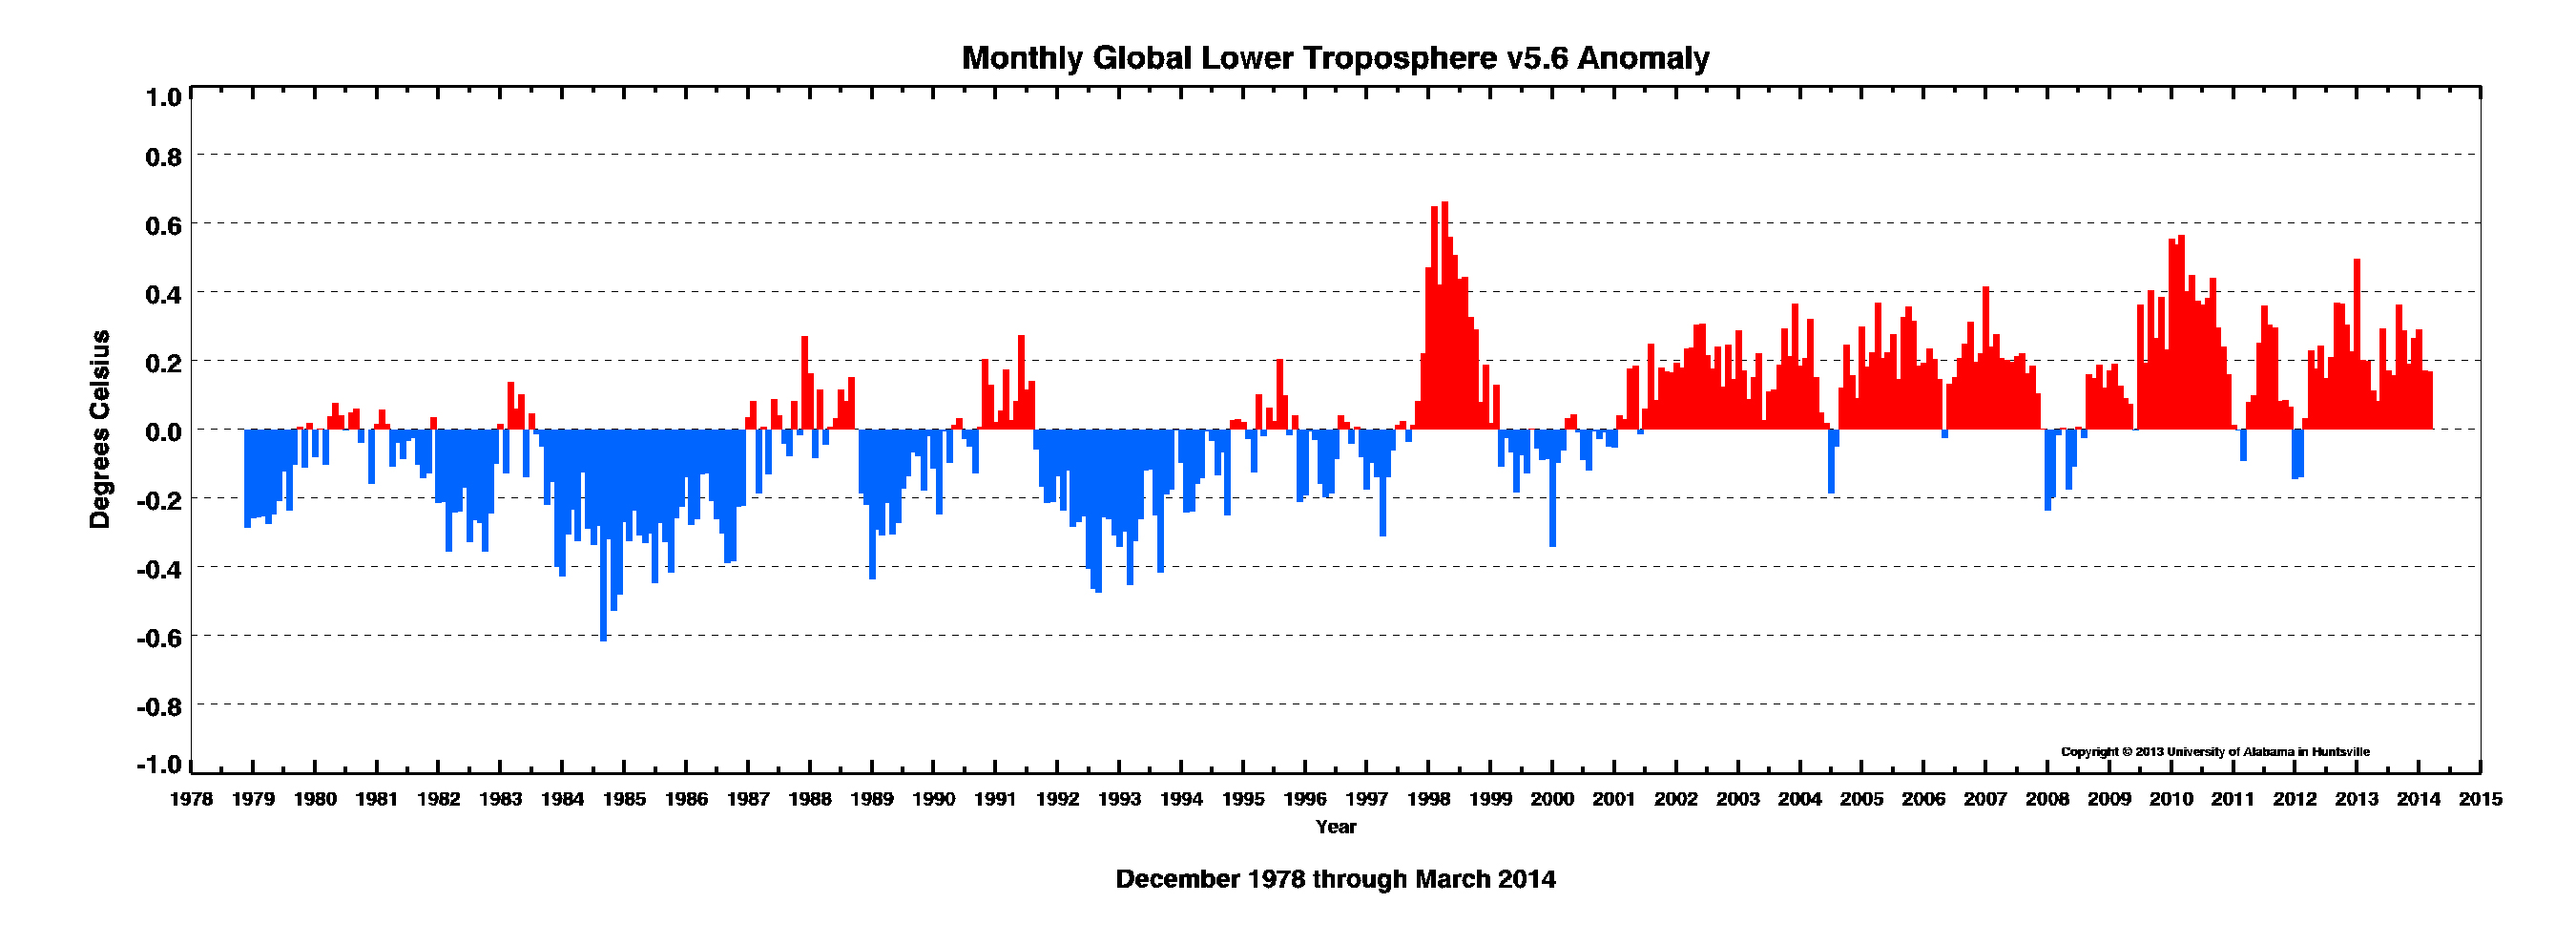
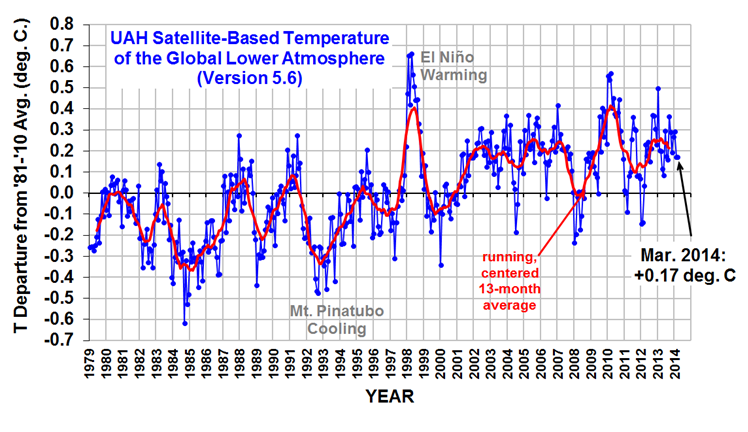
http://nsstc.uah.edu/climate/2014/march/032014_tlt...
http://images.remss.com/msu/msu_time_series.html
Whats the difference between these data sets? One is surface temps while the other deals lower tropospheric temps. Though this has been pointed out many times before it continues being brought up in here. Why do you think this is? And why are do there continue to be arguments concerning these types of things?
9 Answers
- antarcticiceLv 77 years agoFavorite Answer
Deniers do seem to like their little myths, like kano and his Moncton inspired 17yrs 8 months, rather an odd claim given 1996 was at the time a bit cool at 0.33c while the year before was warmer at 0.43c and the years after also warmer 97' - 0.46c and of course 98' - 0.62c. Look at the temperature data and it's pretty easy to see that 98' was well above the trend and in fact the two years following this strong El Nino fell back to the 0.4c range.
For their claim of no warming since 98' deniers try quite hard to ignore that 2010 and 2005 where warmer and if you factor in the effect of the strong 97/98 El Nino, years like 02, 03, 06, 07, 09, 12 and 13 would also have been warmer than 98'
You could of course use the decadal average which had the 1990's as the warmest decade, but this was replaced by the decade of the 2000's which was on average 0.2c warmer, which is inline with the average per decade rise estimated by the IPCC.
http://www.ncdc.noaa.gov/sotc/global/2010/13#gtemp
and while there is a little variation in real temperature data sets, UEA's show a very similar trend
http://www.cru.uea.ac.uk/cru/data/temperature/HadC...
They also show 98's as a strong anomaly, but they also show far more consistent high temperatures in the 2000's than in the 1990's. This is of course why deniers like UAH (which is really just Roy Spencer) as his graphs consistently try to show cooler temps and usually well below the three real agencies that produce global temperature data, it's only deniers that pretend UAH is one of these agencies, in much the same way they pretend Watts is a meteorologist.
Then we have this maths gem from from zippo
"Current cumulative warming above the mean temperature from 1978 to present is 0.17C or 0.005C per year or 0.05C per decade. That's 36 years equaling a total warming of 0.17C. "
Evidently he is trying to claim a rise (above the mean) since 1973 0f just 0.17c
Which is interesting given that the temps for 1973 was 0.16c, zippo picked it because it was a small spike year, but even with that we are currently having yearly yearly average hovering around high 0.5's to low 0.6's or more than double the figure zippo is trying to suggest.
Pick one of a number of years around 1973
1971 - -0.07c
1972 - 0.02c
1973 - 0.16c
1974 - -0.07c
1975 - -0.01c
http://climate.nasa.gov/key_indicators#globalTemp
Pretty easy to see why zippo tried to use 1973 as the starting point to play with his statistic, a sadly common denier ploy and one that would not fool a school kid. But had he of course used a more truthful figure then his number would have had to be more like 5.5c - 6c instead of his invented 0.17c.
Why deniers try to play these childish games is anyone's guess all they really do is reveal their own nature.
- ?Lv 67 years ago
Warming water and melting ice.. it's happening. Nobody denies that. Glaciers are melting, tundra now sports brush and small trees and reefs are dying... all of that has been observed, noted, photographed and recorded. The only thing that can warm water and melt ice and thaw tundra is heat. True, atmospheric heat is an up and down, a situation that varies from decade to decade, though the heat index is more up than down. The CO2 index continues to rise...from 286ppm in pre Industrial Revolution times to a 400ppm current reading...an increase of 12 to 15ppm per decade ALL of it caused by burning fossil fuels. The 'greenhouse effect' is real...it traps heat.
The 'heat' of course does not stay in the atmosphere... it moves rapidly to a cooler venue... seawater and ice. That's what the data, the science and the physics of heat and atmosphere tell us. Summers are slightly longer and winters are slightly shorter. Tropical insects are known to be moving slowly north and the tree line is moving both higher and further north. In the southern hemisphere its a bit different because there's more ocean and less land mass, but in the northern hemisphere the historically rapid changes can't be denied. No Al Gore required.
- Anonymous7 years ago
I can tell you one thing for certain. I don't know if has been warming for the past 17 years or not. I do know, however, that it sure does not look exponential to me. And 97% of the warming model overestimating should tell you something. It should tell you that you warmers are exaggerating. And do you want to discuss what the press does when they get ahold of the story. Then we get that uninhabitable world crap.
You literally have people coming here on a daily basis thinking the world is going to end. And you want to pretend that you hold some moral high ground??? LMFAO!!!
You may be right that some "deniers" are incorrect on a number of things, but they are not wanting to tax me. Don't you expect more from people you are paying than people you are not???
Gary F,
Instead of the already present and economical solution of nuclear power, you warmer yammer on and on about taxation.
First, you are not going to get a tax through Congress during a recession. You couldn't get a carbon tax through when you had Dems controlling both houses of Congress and the presidency.
So please tell me how you are EVER going to get your idiot solutions through.
Second, taxation is to support emerging technologies. This means they are currently NOT READY. Assuming you got this tax plan through tomorrow, it would take more than 40 years to get he US down to low CO2 levels.
You claim to need this now???
I have provided a plan that would take 30 years for FULL implementation and start reductions with the first nuclear plant. And who stops nuclear in the US??? If you said the greenie-weenies, you would be right.
But you continue with your lies. You continue to act like you are trying to save this poor planet from the idiots. How is that working for you? How is that going getting a carbon tax through Congress?
Please tell me the difference between an unproductive genious and an unproductive idiot.
- 7 years ago
For the past couple of hundred years global temperatures seem to show a steadily rising trend superimposed with a sinusoidal-like variation.
When the effects sum to produce a large warming trend then one side makes all the noise.
When the effects cancel then the other side makes all the noise.
Can't you see how childish this is?
- KanoLv 77 years ago
Jeff M. I am dissapointed with you, lowering yourself down to the level of all the other cherry pickers.
It is generally aknowledge by all scientists that there has been a hiatus, pause or whatever you want to call it, the reasons for it are in dispute, but not the fact that it is real is not.
Actually surface temps are never measured, most thermometers are set approx 6ft high.
It is not denied that the last few decades have been very warm, but it also true that they are not skyrocketing the way CO2 is.
Edit
Well if not cherry picking why show warming all the way from 1880 when the matter in question is the last decade or so.
Edit
Well Moncton shows temps from 1996 and claims 17yrs 8 months.
I prefer 2000 onward which is clearly no warming.
Yes I dont study all the temperatures I prefer UAH as my standard reference.
Jeff I am not cherry picking by using UAH it is the one I trust the most, I dont actually want to know what the surface temp is, I want to know if it is rising or falling, I am interested in the trend and UAH is fine for that
http://www.drroyspencer.com/wp-content/uploads/UAH...
hmm 0.17C since 1979 is that considered statistically significant?
- Anonymous7 years ago
It's funny when yearly data sets are based on averages of averages. The biggest problem alarmists have is "nailing down" the Earth's actual temperature. Yearly average temperatures are exactly averages of averages. If we could have taken the temperatures in 1900 in the same manner as we do today, it still wouldn't tell us anything about Global average temperatures simply because temperature readings can't be simultaneously taken on an equal scale (how high up in the atmosphere or even how far below the surface do we consider "GLOBAL").
Heat energy is already known to go out to space along with being buried beneath the surface, but where are the documented time lapses along with the heat rises and falls?
Current cumulative warming above the mean temperature from 1978 to present is 0.17C or 0.005C per year or 0.05C per decade. That's 36 years equaling a total warming of 0.17C.
However, if I use http://data.giss.nasa.gov/gistemp/tabledata_v3/GLB... as a measure of "Global" average temperatures, then I come up with a bit more of an increase (14.19C March of 1978 - 14.45C March of 2014) equaling 0.26C over 36 years or .007C per year or .07C per decade.
The rate of temperature increase since 1880 has not changed, yet the rate of CO2 has more than doubled and has, in fact, almost tripled since 1958 http://www.drroyspencer.com/global-warming-backgro... , which means that the correlation between CO2 and temperature is non-existent.
Looks like we are back to "Climate Change" again.
You lose on that one too it seems. Global average temperature variability over the past 15 years has been much less than in previous years. Seems as though an equilibrium point is being reached as of late. That makes sense when you consider that tornado and hurricane frequency seem to be declining. Your last line in defense of Anthropogenic Climate Change rests on the severity of weather changes, which is highly debatable simply due to the lack of measurements from previous weather events and forming a comparison to modern storms.
- ?Lv 77 years ago
>>it was stated that 'enviros' stand in the way of advancement<<
The only thing that stands in the way of advancement is stupidity and belief in imaginary conspiracies and evils - and Deniers have cornered the market on both.
=====
Kano –
>>when the matter in question is the last decade or so.<<
What question? There cannot be a question unless there is a way to answer it. Shows us any scientific way to study any question about the last 10 years. Name one mathematical test that applies to anything you have ever said about the last 10 years – or 20 – or just demonstrate that you know one mathematical test about anything in the universe.
>>Well Moncton shows temps from 1996 and claims 17yrs 8 months.<<
Show one mathematical test that “shows” anything.
>>I prefer 2000 onward which is cleary no warming.<<
How can it clearly show that? Again, provide a mathematical statement that shows anything abuout the period since 2000.
>>Yes I dont study all the temperatures I prefer UAH as my standard reference.<<
You do not study anything – you do not know how to study anything – because you do not know what anything is, means, or shows about anything.
======
C --
>>Surface temps have not really flatlined, they have however not been statically significant. <<
That is not true. The probability that global temperatures since 2000, 1998, or whenever are from a different climate system than the preceding temperatures is almost 100%/ All you have to do is run a simple t-test.
Also, "statistical significance" has nothing to do with anything being "important" or "significant." It is simply a measure of reliability that a sample population is representative of the true population. If your sample depth is too small nothing is statistically significant regardless of how relevant and important it may actually be. On the other hand, if you have all available information (i.e., a 100% sample) then everything is statistically significant even if it is completely unrelated, irrelevant, and unimportant.
- ?Lv 57 years ago
Surface temps have not really flatlined, they have however not been statically significant. They have however slowed to a crawl (@0.2C average per year). BUT GW has not stopped, it is just that most of the heat has been settling in the ocean surfaces
- ?Lv 77 years ago
Jeff M, I can see you are changing the standards again. What are you doing? are you still looking for that missing heat? Look under the Dorkster's bed. Maybe it is there. But wear gloves.
